

For my Probability and Statistics course, I've been working often with the normal distribution. It was tedious to be flipping pages looking up normal distribution values in the table at the end of the textbook, and so I wrote a quick little program.
VisualNormalDistribution is now online, here!
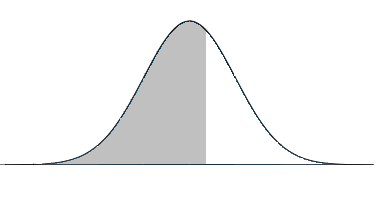
I know there are already online tools like SurfStat, but I like features I added in my program VisualNormalDistribution: you can tab through the fields more easily and simply press Return to evaluate. Also, I wrote a graphical display of the area under the curve (using CSS and transparency). The display is practical, too, intuitively you can see that you are measuring the right value.